
the modiful

This sketch is meant to draw a mesmerizing rainbow spiral that grows outward from the center of the screen, with each dot colored by cycling through the HSB hue wheel and old dots fading into a soft black trail. As written, the file actually contains two corrupted lines (a mangled variable name and stray text after the last function) that will stop it from running at all, which makes it a great real-world exercise in reading error messages and debugging.

🧪 Try This!

Experiment with the code by making these changes:

  1. Fix the crash-causing typo — The ellipse() call references a garbled variable name instead of dotSize, which throws a JavaScript error and stops the entire sketch from drawing anything - fixing it is required before any other experiment will be visible.
  2. Remove the stray text breaking the file — There is leftover garbage text after windowResized()'s closing brace that causes a JavaScript syntax error, preventing the whole script from being parsed at all - deleting it lets the file run.
  3. Make the spiral actually rotate over time — Right now the spiral is recomputed from scratch every frame starting at angle 0, so it never visibly moves. Basing the starting angle on frameCount makes the whole spiral spin continuously.
  4. Loosen the spiral's turns — Increasing angleIncrement makes the spiral wind more loosely, with fewer, more widely-separated arms.
  5. Leave longer glowing trails — Lowering the alpha value in background(0, 10) makes each frame erase less of the previous one, so dots fade out much more slowly and leave longer streaks.
Prefer the full editor? Open it there →

📖 About This Sketch

This sketch's intent is to fill the screen with a glowing spiral of dots, each one colored by sliding through the HSB hue wheel so the whole shape reads like a rainbow pinwheel, with a translucent black background layered on top every frame to leave soft fading trails. It leans on core p5.js ideas: colorMode(HSB, ...) for hue-based color, translate() to recenter the drawing origin, trigonometric cos()/sin() to convert an angle-and-radius pair into x/y pixel coordinates, and a while loop that keeps adding dots until the spiral reaches the edge of the canvas.

The code is organized into the three functions p5.js expects: setup() runs once to prepare the canvas and color mode, draw() runs every frame to redraw the spiral, and windowResized() keeps the canvas matching the browser window. Studying it teaches polar-coordinate drawing, HSB color cycling, and alpha-based trail effects - but you'll also need to spot and fix two typos that currently crash the sketch, which is exactly the kind of debugging every beginner needs practice with.

⚙️ How It Works

  1. When the page loads, setup() creates a full-window canvas, switches to HSB color mode (so colors are described by hue/saturation/brightness instead of red/green/blue), turns off shape outlines, and paints the background solid black.
  2. Every frame, draw() first paints a nearly-transparent black rectangle over the whole canvas - because it's only 10% opaque, old dots don't vanish instantly, they fade gradually, leaving soft trailing streaks.
  3. draw() then moves the coordinate origin to the center of the screen with translate(), so all the spiral math can be written as if (0,0) is the middle of the canvas.
  4. A while loop repeatedly computes an x,y position from a growing angle and radius (using cos() and sin() to convert polar coordinates to Cartesian ones), picks a hue based on the current angle, and is supposed to draw a small circle there - each pass through the loop nudges the angle and radius forward slightly, which is what traces out the spiral shape.
  5. Because the loop redraws the exact same angle/radius sequence starting from 0 every single frame, the spiral itself never actually moves or rotates - only the fading background gives any sense of motion, which is a good thing to notice and experiment with.
  6. windowResized() automatically fires whenever the browser window changes size, resizing the canvas and clearing it so the spiral isn't left distorted or stretched.

🎓 Concepts You'll Learn

HSB color modePolar to Cartesian coordinate conversiontranslate() and coordinate originswhile loops for procedural drawingAlpha transparency for trail effectswindowResized() for responsive canvases

📝 Code Breakdown

setup()

setup() runs exactly once when the sketch starts. It's the right place to configure things that don't need to change every frame, like canvas size and color mode - here HSB mode is chosen specifically because it makes rainbow hue-cycling effects (like this spiral) much easier to write than RGB.

function setup() {
  // Create a canvas that fills the entire browser window
  createCanvas(windowWidth, windowHeight);
  // Set the color mode to HSB (Hue, Saturation, Brightness)
  // Hue ranges from 0 to 360, Saturation and Brightness from 0 to 100, Alpha from 0 to 100
  colorMode(HSB, 360, 100, 100, 100); // https://p5js.org/reference/p5/colorMode/
  // Do not draw outlines around shapes
  noStroke(); // https://p5js.org/reference/p5/noStroke/
  // Set the background color to black
  background(0); // https://p5js.org/reference/p5/background/
}
Line-by-line explanation (4 lines)
createCanvas(windowWidth, windowHeight);
Makes the drawing surface exactly as big as the browser window, so the spiral fills the whole screen.
colorMode(HSB, 360, 100, 100, 100);
Switches from the default RGB color system to HSB (hue, saturation, brightness). Hue goes from 0-360 like a color wheel, which makes cycling through rainbow colors as simple as changing one number.
noStroke();
Turns off the outline that would normally be drawn around every shape, so the dots look like soft solid circles instead of circles with borders.
background(0);
Fills the entire canvas with black once at the start, giving the spiral a dark backdrop to glow against.

draw()

draw() runs continuously, about 60 times per second, and is where all animation logic lives. This particular draw() recomputes the entire spiral from scratch every single frame using local variables - a useful pattern to notice is that because angle and radius always restart at 0, the spiral's shape never actually changes frame to frame; only the fading background trail creates any illusion of movement.

🔬 These two lines push the spiral outward and around on every loop pass. What happens if you triple the radius growth so it reads radius += radiusIncrement * 3? Will the spiral reach the edge in fewer, more spread-out dots?

    // Increment the angle and radius for the next dot, creating the spiral effect
    angle += angleIncrement;
    radius += radiusIncrement;
  }

🔬 The hue here is simply the angle, wrapped with %360. What happens if you multiply angle by 4 before the modulo, like fill((angle * 4) % 360, 100, 100)? Would the rainbow cycle repeat more times around the same spiral?

    // Set the fill color using HSB, cycling hue from 0 to 360
    fill(angle % 360, 100, 100); // https://p5js.org/reference/p5/fill/
function draw() {
  // Draw a semi-transparent black background.
  // This creates a subtle trailing effect as old circles fade out.
  background(0, 10); // https://p5js.org/reference/p5/background/

  // Move the drawing origin to the center of the canvas
  translate(width / 2, height / 2); // https://p5js.org/reference/p5/translate/

  let angle = 0; // Starting angle for the spiral
  let radius = 0; // Starting radius for the spiral
  let angleIncrement = 0.1; // How quickly the spiral turns (smaller value = more turns)
  let radiusIncrement = 1.5; // How quickly the spiral expands
  let dotSize = 5; // Size of each dot in the spiral

  // Continue drawing dots as long as the radius is within the canvas bounds
  while (radius < min(width, height) / 2) { // https://p5js.org/reference/p5/min/
    // Calculate the x and y coordinates using polar to Cartesian conversion
    let x = radius * cos(angle); // https://p5js.org/reference/p5/cos/
    let y = radius * sin(angle); // https://p5js.org/reference/p5/sin/

    // Set the fill color using HSB, cycling hue from 0 to 360
    fill(angle % 360, 100, 100); // https://p5js.org/reference/p5/fill/

    // Draw a circle at the calculated position
    ellipse(x, y, dotSibubwnuwwgbwggwgwgrgmqg ug4 gbn e8374e893ze, dotSize); // https://p5js.org/reference/p5/ellipse/

    // Increment the angle and radius for the next dot, creating the spiral effect
    angle += angleIncrement;
    radius += radiusIncrement;
  }
}
Line-by-line explanation (11 lines)

🔧 Subcomponents:

while-loop Spiral Drawing Loop while (radius < min(width, height) / 2) {

Repeatedly places one dot further out and further around than the last, tracing the spiral shape until it reaches the edge of the canvas.

background(0, 10);
Draws black at only 10% opacity over the whole canvas. Instead of erasing everything instantly, this slightly darkens what's already there, which is why old dots appear to fade out gradually rather than disappear immediately.
translate(width / 2, height / 2);
Shifts the (0,0) origin point to the middle of the canvas, so every shape drawn afterward is positioned relative to the center instead of the top-left corner.
let angle = 0;
Starts the spiral's angle at 0 radians every frame - this is a local variable that only exists while draw() is running.
let radius = 0;
Starts the spiral's distance from the center at 0 every frame, so each frame's spiral begins right at the origin.
while (radius < min(width, height) / 2) {
Keeps looping - and adding more dots - as long as the spiral's current radius hasn't yet passed half of the smaller canvas dimension, which keeps the whole spiral safely inside the screen.
let x = radius * cos(angle);
Converts the polar coordinate (angle, radius) into a Cartesian x position using cosine - this is the standard trigonometry trick for turning 'how far and which direction' into 'left/right position'.
let y = radius * sin(angle);
Does the same conversion for the y position using sine, completing the polar-to-Cartesian conversion.
fill(angle % 360, 100, 100);
Sets the dot's color using the current angle as the hue (0-360 in HSB mode), with full saturation and brightness. As angle grows, the color slides around the entire rainbow.
ellipse(x, y, dotSibubwnuwwgbwggwgwgrgmqg ug4 gbn e8374e893ze, dotSize);
This line is broken - it references a variable name that was never declared anywhere in the file (it should almost certainly say dotSize, dotSize). Because that variable doesn't exist, this throws a ReferenceError and stops the whole sketch from running.
angle += angleIncrement;
Nudges the angle forward a little bit so the next dot is drawn slightly further around the circle.
radius += radiusIncrement;
Nudges the radius outward a little bit so the next dot is drawn slightly further from the center, which is what makes the shape spiral outward instead of just circling in place.

windowResized()

windowResized() is a special p5.js function that p5 automatically calls whenever the browser window changes size. Pairing it with resizeCanvas() is the standard way to keep a full-window sketch responsive.

function windowResized() {
  // This function is called automatically when the browser window is resized.
  // We resize the canvas to match the new window dimebrbbrkmbmkrmgjhbyg nsions, keeping the sketch responsive.
  resizeCanvas(windowWidth, windowHeight); // https://p5js.org/reference/p5/resizeCanvas/
  // Clear the background when the window is resized to prevent artifacts
  background(0);
}
Line-by-line explanation (2 lines)
resizeCanvas(windowWidth, windowHeight);
Changes the canvas size to match the browser window's new width and height, keeping the sketch filling the screen after a resize.
background(0);
Repaints the whole canvas solid black so the resize doesn't leave stretched or leftover pixels from the old canvas size.

📦 Key Variables

angle number

The current angle (in radians) used to compute each dot's position and hue. It is declared with let inside draw(), so it resets to 0 at the start of every single frame rather than persisting across frames.

let angle = 0; // Starting angle for the spiral
radius number

The current distance from the canvas center for the dot being drawn. Also local to draw() and reset to 0 every frame, which is why the spiral looks identical frame after frame.

let radius = 0; // Starting radius for the spiral
angleIncrement number

How much the angle grows on each pass through the while loop - smaller values make the spiral wind tighter with more visible turns.

let angleIncrement = 0.1;
radiusIncrement number

How much the radius grows on each pass through the while loop - controls how quickly the spiral expands outward and how spaced-out the dots look.

let radiusIncrement = 1.5;
dotSize number

Intended diameter for each ellipse drawn along the spiral. It is declared but never actually reaches the ellipse() call because of the corrupted argument name, which is why fixing that bug is the first step to seeing this sketch run.

let dotSize = 5;

🔧 Potential Improvements (5)

Here are some ways this code could be enhanced:

BUG draw() - ellipse() call

The third argument to ellipse() is the corrupted token 'dotSibubwnuwwgbwggwgwgrgmqg ug4 gbn e8374e893ze' instead of the declared variable dotSize. Since that identifier was never defined, this throws a ReferenceError and stops the sketch from drawing anything at all.

💡 Replace the broken argument with dotSize (and again for the height argument): ellipse(x, y, dotSize, dotSize);

BUG end of file, after windowResized()

Stray text ('nfdhgpp e onen. unfufnh') appears directly after the final closing brace of windowResized(). This is not valid JavaScript syntax, so the entire script fails to parse and none of the functions - setup(), draw(), or windowResized() - will ever run.

💡 Delete everything after the final '}' so the file ends cleanly with the closing brace of windowResized().

BUG draw()

angle and radius are both reset to 0 at the top of draw() every frame, so the exact same spiral is recomputed and redrawn in the same place on every frame. The only thing that visually changes frame to frame is the fading background, so the spiral itself never rotates or grows over time despite looking like it should.

💡 Make angle (and optionally radius) persist across frames by declaring them as global variables outside draw(), or derive the starting angle from frameCount (e.g. let angle = frameCount * 0.01;) so the spiral visibly spins.

PERFORMANCE draw()

angleIncrement, radiusIncrement, and dotSize are re-declared with the same fixed values inside draw() on every single frame, which is unnecessary work repeated 60 times a second even though the values never change.

💡 Move these three declarations above setup() as global variables (or const values) so they're created once instead of every frame - this also makes them easier to find and tweak in one place.

STYLE style.css

The body rule contains corrupted text ('gvhgn hjfnjr nb bj fu. btjthe center of gravity') inserted between the color and text-align declarations, which breaks CSS parsing for that chunk and silently drops the text-align: center rule.

💡 Remove the garbled text so the rule reads cleanly: color: white; text-align: center;

🔄 Code Flow

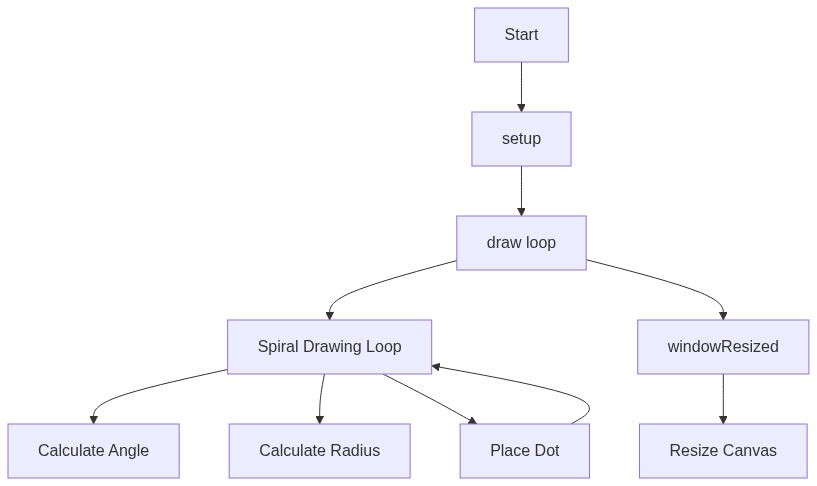
Code flow showing setup, draw, windowresized

💡 Click on function names in the diagram to jump to their code

graph TD start[Start] --> setup[setup] setup --> draw[draw loop] draw --> spiralwhileloop[Spiral Drawing Loop] spiralwhileloop --> angle[Calculate Angle] spiralwhileloop --> radius[Calculate Radius] spiralwhileloop --> placeDot[Place Dot] placeDot --> spiralwhileloop draw --> windowresized[windowResized] windowresized --> resizeCanvas[Resize Canvas] click setup href "#fn-setup" click draw href "#fn-draw" click spiralwhileloop href "#sub-spiral-while-loop" click angle href "#sub-angle" click radius href "#sub-radius" click placeDot href "#sub-place-dot" click windowresized href "#fn-windowresized" click resizeCanvas href "#sub-resize-canvas"

❓ Frequently Asked Questions

What does the modiful sketch create visually?

The modiful sketch creates a visually captivating spiral of colorful dots that radiate outward from the center of the canvas. The colors cycle through the HSB color spectrum, and a semi-transparent background allows for a trailing effect as the dots fade out.

How can users interact with the modiful sketch?

This sketch is not interactive in the traditional sense; instead, it continuously generates an animated spiral of dots based on mathematical calculations. The animation drives itself through a loop that updates the position and color of the dots over time.

What creative coding technique does the modiful sketch demonstrate?

The modiful sketch demonstrates the technique of polar coordinates, where points are drawn in a spiral formation using angle and radius calculations. It effectively combines this with a color cycling effect based on the angle to create a dynamic visual experience.

How could someone recreate a similar effect in p5.js?

To recreate a similar effect in p5.js, one can use a while loop to draw points in a spiral by converting polar coordinates to Cartesian coordinates with sine and cosine functions. Adjusting the angle and radius incrementally while cycling through color values in the HSB color mode will produce a vibrant spiral animation.

Preview

the modiful - p5.js creative coding sketch preview
Sketch Preview
Code flow diagram showing the structure of the modiful - Code flow showing setup, draw, windowresized
Code Flow Diagram